A Review of Your Month
The end of the month is a time when many of us look back over our last month's progress and achievments It's also a great time to plan more training and set goals for future months.
Quick View Stats You will find a range of quick view stats along the top of your personal homepage, including the number of runs you have done this year and the total distance you have run. This is updated each time you log a run and is automatically reset on January 1st ready for the next year.
Check your Personal Bests
My PB's (routes)- lists your Personal Bests for each route you have logged My PB's (distance) - lists your personal Bests for various standard distances My Best age-grades lists your top 20 age grades of all time
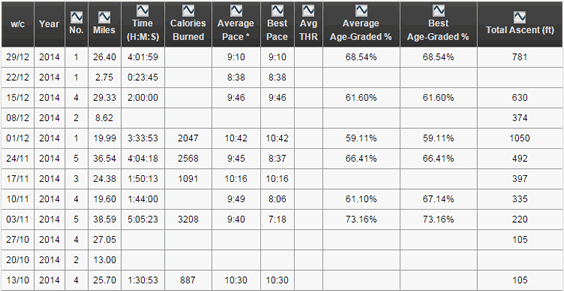
Review your Races A customisable list of races you have run Your stats in table form To compare your training by week/month or year, click on the Wkly/Mthly/Yrly stats button on the left hand side of your log book. Here you can view in table form the number of miles you have run, overall time, average pace, best pace, average age grading and best age grading for your selected period. you can also use this to analyse by run type, terrain and even the shoes you used. You can also do the same for cycling, swimming and other sports
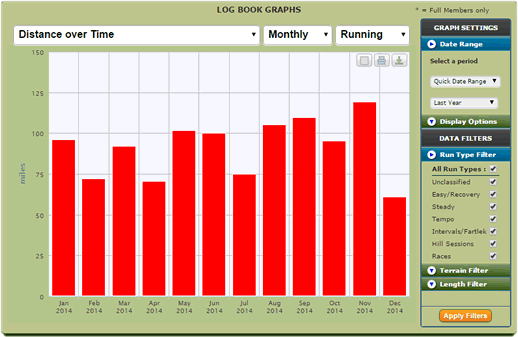
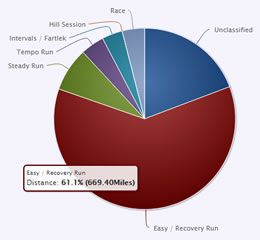
Your Stats in graph form If you would like to see your data in graph form, then click on the Log Book Graphs button. There are lots of colourful block and pie graphs to choose from, including Distance over Time, Planned Distance by Run Type, Pace over Time and Calories burnt by activity over time, to name but a few.
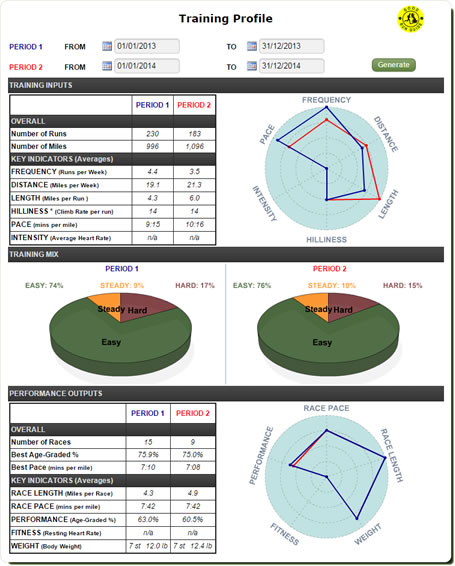
Compare 2 periods of your choice To compare any 2 periods of your choice, e.g. Jan 2017 and Feb 2017 click on the Compare 2 Periods button. This will come up with detailed statistics and pie charts for the periods selected. What to look for! It can be great fun and also motivating to look back on your training For many of us one of the enjoyable aspects of running is looking back on what they've done. Slogging up those hills, through that mud or running lung busting 5Ks, all seem worthwhile when we look back on our achievements. For beginner and still improving runners, it's often very satisfying as PB's become easier to set and pace increases and those little gold stars flag up. The PB's by distance table can be particularly satisfying and graphs such as the speed over time can be great motivators. If you have reached the stage where PBs are harder to come by (all long term runners get there eventually) there are plenty of other things to concentrate and improve on, e.g. varying distance or terrain and taking up new challenges. Increasingly important when this happens can be age graded percentages, as age is taken into account, and improving this can become a new goal.
What do you conclude? Just racking up those miles and therefore keeping fit and challenging yourself is achievement enough for many of us. But, if you look back and feel that you haven't improved as much as you would like, then there are plenty of stats that can point to what you need to do to improve. Have a look at our Training Guide to see advice on the type and intensity of recommended training. For example, you can analyse by pace and run type to see if you are doing enough speedwork or perhaps are doing too many miles just jogging. Alternatively if you get a lot of injuries you can check to see if you are actually overtraining before these occur. So there we have it, there's so much to analyse and marvel over. You can either use these stats for your own satisfaction or use them to plan your future training and goals, or best of all use them for both! Happy Running from all of us at Good Run Guide.
|

 To check and enjoy your Personal Bests, click on the relevant button on the left hand side of your log book.
 Good Run Guide - The UK's Leading Independent Running Website